
In my previous posts on Modding My Rowing Machine, I wired up an Arduino to my rowing machine, and streamed the speed sensor data to an ASP.NET core application.
In this post, I’m going to show you how to take sensor and counter data, push it to a browser as it arrives, and display it in a real-time chart.
If you want to skip ahead, I’ve uploaded all the code for the Arduino and ASP.NET components to a github repo at https://github.com/alistairjevans/rower-mod.
I’m using Visual Studio 2019 with the ASP.NET Core 3.0 Preview for all the server-side components, but the latest stable release of ASP.NET Core will work just fine, I’m not using any of the new features.
Pushing Data to the Browser
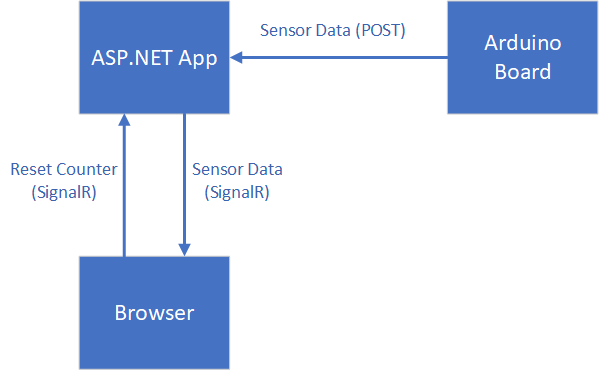
So, you will probably have heard of SignalR, the ASP.NET technology that can be used to push data to the browser from the server, and generally establish a closer relationship between the two.
I’m going to use it send data to the browser whenever new sensor data arrives, and also to let the browser request that the count be reset.
The overall component layout looks like this:
Setting up SignalR
This bit is pretty easy; first up, head over to the Startup.cs file in your ASP.NET app project, and in the ConfigureServices method, add SignalR:
| public void ConfigureServices(IServiceCollection services) | |
| { | |
| // Define a writer that saves my data to disk | |
| var folderPath = Path.Combine(Environment.GetFolderPath(Environment.SpecialFolder.ApplicationData), | |
| "rower"); | |
| services.AddSingleton<ISampleWriter>(svc => new SampleWriter(folderPath, "samples")); | |
| // Keep my machine state as a singleton | |
| services.AddSingleton<IMachineState, MachineState>(); | |
| services.AddControllersWithViews() | |
| .AddNewtonsoftJson(); | |
| services.AddRazorPages(); | |
| // Add signalr services | |
| services.AddSignalR(); | |
| } |
Next, create a SignalR Hub. This is effectively the endpoint your clients will connect to, and will contain any methods a client needs to invoke on the server.
| public class FeedHub : Hub | |
| { | |
| private readonly IMachineState machineState; | |
| private readonly ISampleWriter sampleWriter; | |
| public FeedHub(IMachineState machineState, ISampleWriter sampleWriter) | |
| { | |
| this.machineState = machineState; | |
| this.sampleWriter = sampleWriter; | |
| } | |
| public void ResetCount() | |
| { | |
| // Reset the state, and start a new data file | |
| machineState.ZeroCount(); | |
| sampleWriter.StartNewFile(); | |
| } | |
| } |
SignalR Hubs are just classes that derive from the Hub class. I’ve got just the one method in mine at the moment, for resetting my counter.
Before that Hub will work, you need to register it in your Startup class’ Configure method:
| public void Configure(IApplicationBuilder app, IWebHostEnvironment env) | |
| { | |
| // | |
| // Omitted standard content for brevity... | |
| // | |
| app.UseSignalR(cfg => cfg.MapHub<FeedHub>("/feed")); | |
| } |
You’re also going to want to add the necessary SignalR javascript to your project. I did it using the “Manage Client-Side Libraries” feature in Visual Studio; you can find my entire libman.json file (which defines which libraries I’m using) on my github repo
Sending Data to the Client
In the MVC Controller where the data arrives from the Arduino, I’m going to push the sensor data to all clients connected to the hub.
The way you access the clients of a hub from outside the hub (i.e. an MVC Controller) is by resolving an IHubContext<THubType>, and then accessing the Clients property.
| public class DataController : Controller | |
| { | |
| private readonly IMachineState machineState; | |
| private readonly ISampleWriter sampleWriter; | |
| private readonly IHubContext<FeedHub> feedHub; | |
| public DataController(IMachineState machineState, ISampleWriter sampleWriter, IHubContext<FeedHub> feedHub) | |
| { | |
| this.machineState = machineState; | |
| this.sampleWriter = sampleWriter; | |
| this.feedHub = feedHub; | |
| } | |
| [HttpPost] | |
| public async Task<ActionResult> ProvideReading(uint milliseconds, double speed, int count) | |
| { | |
| // Update our machine state. | |
| machineState.UpdateMachineState(milliseconds, speed, count); | |
| // Write the sample to file (our sample writer) and update all clients | |
| // Wait for them both to finish. | |
| await Task.WhenAll( | |
| sampleWriter.ProvideSample(machineState.LastSample, machineState.Speed, machineState.Count), | |
| feedHub.Clients.All.SendAsync("newData", | |
| machineState.LastSample.ToString("o"), | |
| machineState.Speed, | |
| machineState.Count) | |
| ); | |
| return StatusCode(200); | |
| } | |
| } |
Pro tip:
Got multiple IO operations to do in a single request, that don’t depend on each other? Don’t just await one, then await the other; use Task.WhenAll, and the operations will run in parallel.In my example above I’m writing to a file and to SignalR clients at the same time, and only continuing when both are done.
Browser
Ok, so we’ve got the set-up to push data to the browser, but no HTML just yet. I don’t actually need any MVC Controller functionality, so I’m just going to create a Razor Page, which still gives me a Razor template, but without having to write the controller behind it.
If I put an ‘Index.cshtml’ file under a new ‘Pages’ folder in my project, and put the following content in it, that becomes the landing page of my app:
| @page | |
| <html> | |
| <head> | |
| </head> | |
| <body> | |
| <div class="container"> | |
| <div class="lblSpeed text lbl">Speed:</div> | |
| <div class="valSpeed text" id="currentSpeed"><!-- speed goes here --></div> | |
| <div class="lblCount text lbl">Count:</div> | |
| <div class="valCount text" id="currentCount"><!-- stroke count goes here --></div> | |
| <div class="btnContainer"> | |
| <button id="reset">Reset Count</button> | |
| </div> | |
| <div class="chartContainer"> | |
| <!-- I'm going to render my chart in this canvas --> | |
| <canvas id="chartCanvas"></canvas> | |
| </div> | |
| </div> | |
| <script src="~/lib/signalr/dist/browser/signalr.js"></script> | |
| <script src="~/js/site.js"></script> | |
| </body> | |
| </html> |
In my site.js file, I’m just going to open a connection to the SignalR hub and attach a callback for data being given to me:
| "use strict"; | |
| // Define my connection (note the /feed address to specify the hub) | |
| var connection = new signalR.HubConnectionBuilder().withUrl("/feed").build(); | |
| // Get the elements I need | |
| var speedValue = document.getElementById("currentSpeed"); | |
| var countValue = document.getElementById("currentCount"); | |
| var resetButton = document.getElementById("reset"); | |
| window.onload = function () { | |
| // Start the SignalR connection | |
| connection.start().then(function () { | |
| console.log("Connected"); | |
| }).catch(function (err) { | |
| return console.error(err.toString()); | |
| }); | |
| resetButton.addEventListener("click", function () { | |
| // When someone clicks the reset button, this | |
| // will call the ResetCount method in my FeedHub. | |
| connection.invoke("ResetCount"); | |
| }); | |
| }; | |
| // This callback is going to fire every time I get new data. | |
| connection.on("newData", function (time, speed, count) { | |
| speedValue.innerText = speed; | |
| countValue.innerText = count; | |
| }); |
That’s actually all we need to get data flowing down to the browser, and displaying the current speed and counter values!
I want something a little more visual though….
Displaying the Chart
I’m going to use the ChartJS library to render a chart, plus a handy plugin for ChartJS that helps with streaming live data and rendering it, the chartjs-plugin-streaming plugin.
First off, add the two libraries to your project (and your HTML file), plus MomentJS, which ChartJS requires to function.
Next, let’s set up our chart, by defining it’s configuration and attaching it to the 2d context of the canvas object:
| window.onload = function () { | |
| var ctx = document.getElementById('chartCanvas').getContext('2d'); | |
| window.myChart = new Chart(ctx, { | |
| type: 'line', | |
| data: { | |
| datasets: [{ | |
| label: 'Speed', | |
| data: [] | |
| }] | |
| }, | |
| options: { | |
| scales: { | |
| xAxes: [{ | |
| type: 'realtime', | |
| delay: 0, | |
| // 20 seconds of data | |
| duration: 20000 | |
| }], | |
| yAxes: [{ | |
| ticks: { | |
| suggestedMin: 0, | |
| suggestedMax: 50 | |
| } | |
| }] | |
| } | |
| } | |
| }); | |
| // The other signalr setup is still here... | |
| } |
Finally, let’s make our chart display new sensor data as it arrives:
| connection.on("newData", function (time, speed, count) { | |
| // This subtract causes the data to be placed | |
| // in the centre of the chart as it arrives, | |
| // which I personally think looks better... | |
| var dateValue = moment(time).subtract(5, 'seconds'); | |
| speedValue.innerText = speed; | |
| countValue.innerText = count; | |
| // append the new data to the existing chart data | |
| myChart.data.datasets[0].data.push({ | |
| x: dateValue, | |
| y: speed | |
| }); | |
| // update chart datasets keeping the current animation | |
| myChart.update({ | |
| preservation: true | |
| }); | |
| }); |
With all that together, let’s see what we get!
Awesome, a real-time graph of my rowing!
As an aside, I used the excellent tool by @sarah_edo to generate a CSS grid really quickly, so thanks for that! You can find it at https://cssgrid-generator.netlify.com/
You can check out the entire solution, including all the code for the Arduino and the ASP.NET app, on the github repo at https://github.com/alistairjevans/rower-mod.
Next up for the rowing machine project, I want to put some form of gamification, achievements or progress tracking into the app, but not sure exactly how it will look yet.

4 replies on “Displaying Real-time Sensor Data in the Browser with SignalR and ChartJS”
Did you find a way to use the sensor data within a game?
LikeLike
Not as yet, no; all the data is there though, just a matter of finding time!
LikeLike
This project seems soo cool! Thank you for sharing! I got a decent rowing machin, but the workout computer is garbage And doesn’t even work, I am playing with the idea of making my own computer. I would love to do something similar with what you have done and aim to do, I especially love the idea of having a game on it because I tend to get bored on workouts. What if you did a game similar to the fish game in the concept two rower?
https://www.concept2.com/service/monitors/pm5/how-to-use/fish-game
LikeLike
Thanks! I hadn’t seen that fish game, it’s definitely a fun idea for a game option.
LikeLike